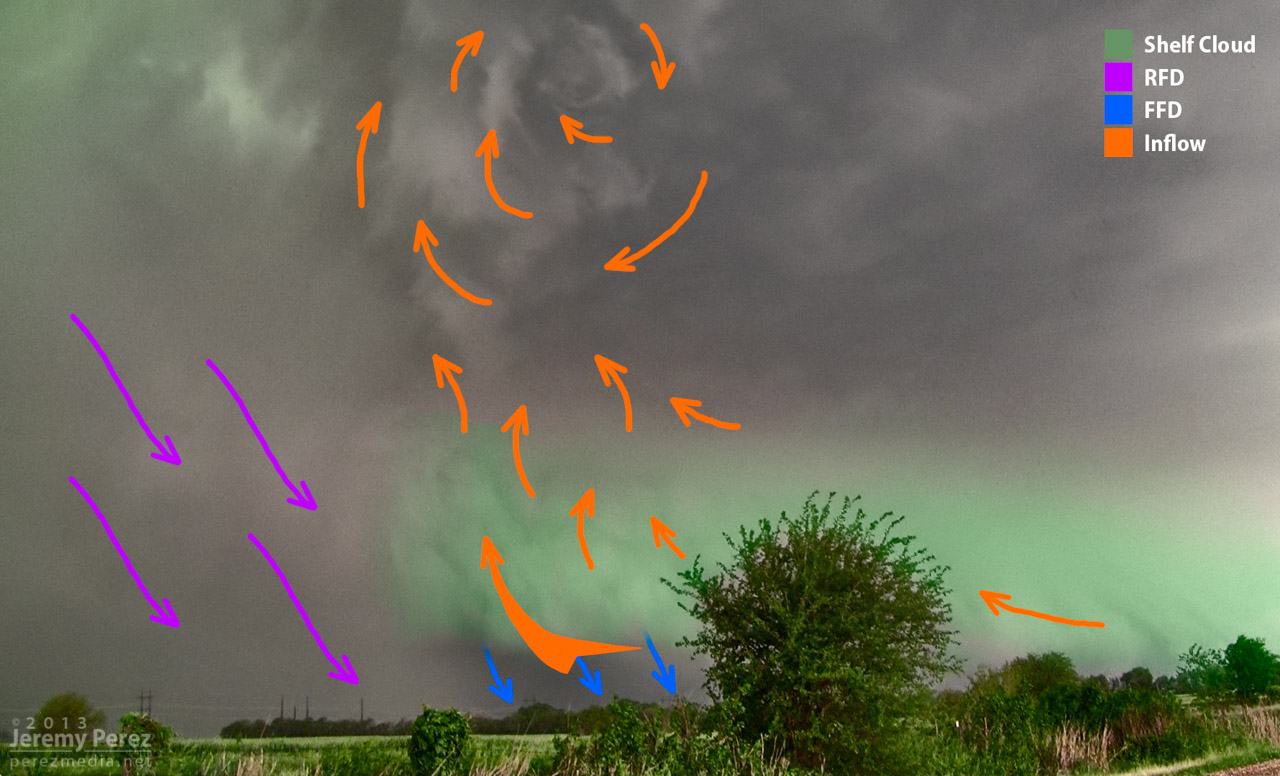
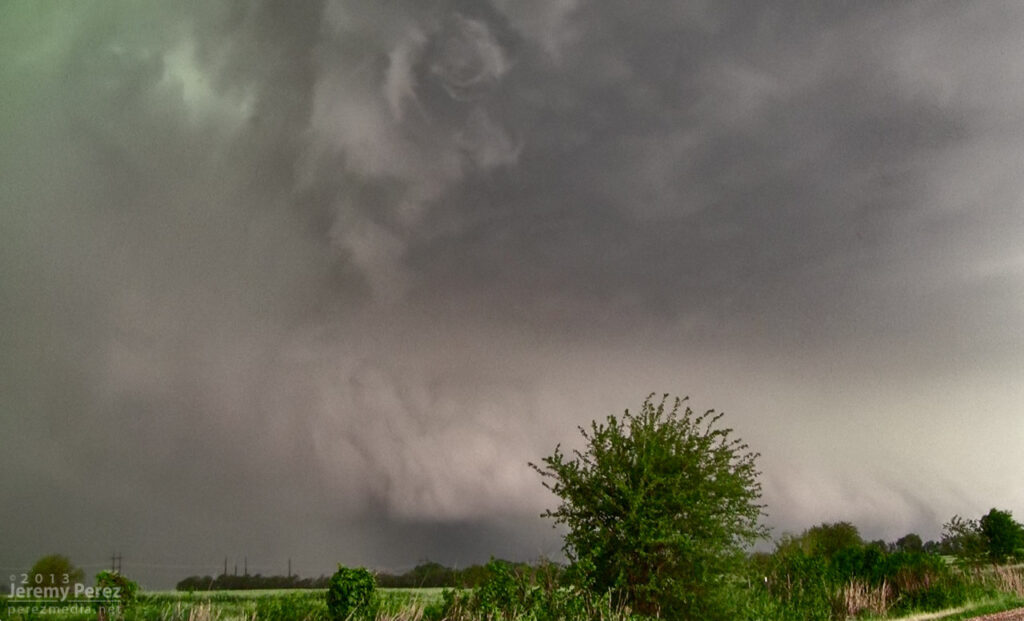
In my previous post, I diagrammed the Oxford, Kansas supercell from 19 May 2013. About 90 seconds after that shot was taken, a new area of low level rotation developed just ahead of the occlusion. This is a diagram of that moment as the inflow was forced into the updraft at that point and rapidly exposing circulation at the cloud base.

Leave a Reply