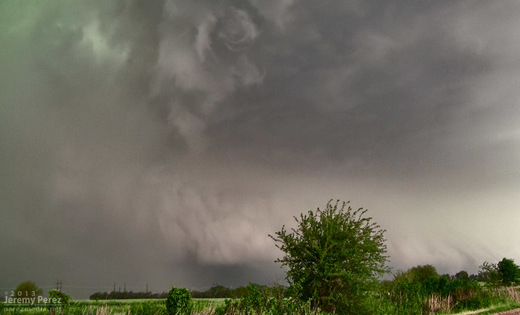
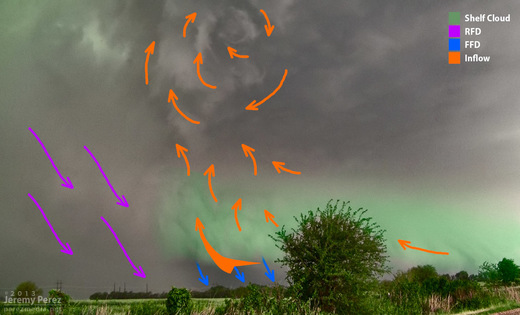
In my previous post, I diagrammed the Oxford, Kansas supercell from 19 May 2013. About 90 seconds after that shot was taken, a new area of low level rotation developed just ahead of the occlusion. This is a diagram of that moment as the inflow was forced into the updraft at that point and rapidly exposing circulation at the cloud base.
January 2015 Archives
19 May 2013 Oxford Supercell Diagram
By Jeremy Perez on January 11, 2015 9:22 PM
Search
About this Archive
This page is an archive of entries from January 2015 listed from newest to oldest.
December 2014 is the previous archive.
March 2015 is the next archive.
Find recent content on the main index or look in the archives to find all content.
Pages
Categories
- Funnel (10)
- Funnel Cloud (6)
- General (1)
- Geology (9)
- Field Trip (1)
- Fluorescent (3)
- Fossils
- Pelecypods
- Petrified Wood
- Minerals (7)
- Agate
- Amethyst
- Calcite (1)
- Magnetite (5)
- Quartz
- Siderite
- Meteorology (48)
- Optics (2)
- Supercell (26)
- Tornado (5)
- Wildfire (1)
- Science (1)
- Southwest Monsoon (10)
- Storm Chase Summary (31)
- Storm Chasing (18)
- Storms (39)
Monthly Archives
- March 2016 (1)
- January 2016 (6)
- October 2015 (1)
- August 2015 (4)
- May 2015 (2)
- April 2015 (1)
- March 2015 (1)
- January 2015 (1)
- December 2014 (1)
- October 2014 (1)
- September 2014 (1)
- July 2014 (1)
- May 2014 (7)
- April 2014 (8)
- December 2013 (1)
- September 2013 (1)
- June 2013 (1)
- March 2013 (2)
- October 2012 (1)
- July 2012 (1)
- April 2012 (1)
- March 2012 (2)
- February 2012 (5)
- October 2011 (1)
- September 2011 (1)
- May 2011 (1)
- October 2010 (1)
- September 2010 (1)
- August 2010 (1)
- June 2010 (6)
- December 2009 (2)
- September 2009 (1)
- August 2009 (3)
- July 2009 (6)


